Start 2020 Right: Get into the Report Habit
Whether or not you made New Year’s resolutions, for many business owners, the beginning of a new year means a fresh start â?? including incorporating new habits that help improve your company’s financial bottom line such as committing to using the reporting tools QuickBooks offers. After all, you can’t possibly know how your business is doing unless you take advantage of this critical feature. Think of it as the payoff for all the hard work you do keeping up with your daily accounting workflow. To help you get started, here’s what you need to do:
Visit QuickBooks’ Report Center
As you know. QuickBooks devotes an entire menu to reports, dividing them into types (Sales, Purchases, Inventory, etc.). When you hover your mouse over one of these categories after opening the Reports menu, you’ll see a list of all related reports.
Click on Report Center, though, and you’ll see a kind of home page for reports. They’re categorized by type, just like in the main Reports menu, but there’s much more you can do here.

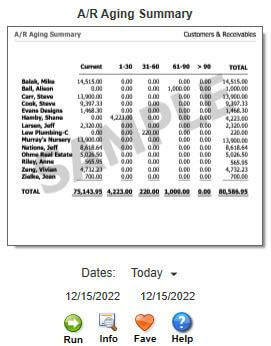
Figure 1: Click on a report name in the Report Center and you’ll have numerous options.
When you click on the graphic representing a report, you’ll first be able to change the date range by clicking on the down arrow. Then you can Run the report, see a brief explanation by clicking Info, click on Fave to add it to your list of Favorites, or open Help. The tabs at the top of the screen allow you to toggle between these Standard views, reports you’ve Memorized, Favorites, Recent, and Contributed (report templates created by individuals outside of Intuit).
If you know exactly what reports you want to run it’s probably easier to just use the Reports menu, but the Report Center is a great place to learn about and organize your content.
Customize Your Reports
You’re probably used to changing the date range on your reports, but have you ever explored any of QuickBooks’ other customization tools? You can use them in any report. Click the Customize Report button in the upper left. Click on the Display tab, and you can change the report’s columns by checking or unchecking entries in the list. Filters are more complex, and you may need our help setting up very specific, multi-filter reports. They offer a way to pare down your report to contain just the data you want. You could, for example, prepare a report that only includes one or more Transaction Types or customers who live in a specified state.
Memorize Your Reports
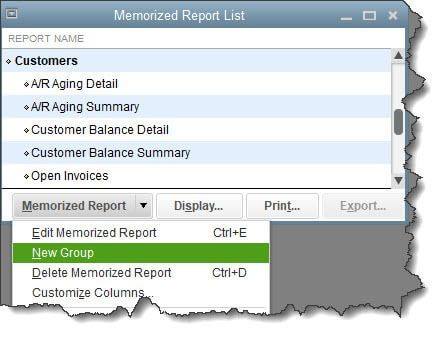
Once you’ve changed columns and filters in a report you’ll run frequently, you can save those settings, so you don’t have to go through all of that again. Open any report and click the Memorize button in the upper toolbar. The window that opens will ask if you want to save that customized report to a Memorized Report Group, which you can do by clicking the box and opening the list of groups. Either way, you can find your report by opening the Reports menu and selecting Memorized Reports.

Figure 2: If you want to create a new Memorized Report Group, open the Reports menu and click Memorized Reports | Memorized Report List. Open the Memorized Report drop-down menu and select New Group.
Schedule Your Reports
The best way to get your report habit started is by creating a schedule of reports you need to see regularly. You can do this by setting up Reminders (Company | Reminders). Click the gear icon in the upper right corner to specify your Preferences and the + (plus) sign to add a reminder. QuickBooks 2017 and later versions offer a scheduling tool that allows you to share reports with others, but please don’t try this on your own; it’s a complicated procedure with many rules.
You’ve probably noticed that there is a report category called Accountant & Taxes. Some of these should be created monthly or quarterly, but you’ll need our help analyzing them as well.
Without knowing the current financial state of your company, it’s difficult to make realistic, effective plans for the future. If you’re ready to start the year off right, help is just a phone call away.

